"The French and the English, in particular, shared a weakness for get-rich-quick schemes. And like a crap-shooter who has a pretty lady to blow on his dice, the speculators in both countries had an amazing array of irrational systems to help them win money. They had to guess which direction the American bond market would take: up or down. The systems usually involved staring for hours at charts showing the history of bond prices. As in Rorschach ink blots, an unlikely formation, such as a human head and shoulders, made itself privately known to the viewer. The chartist-for that is what such a person called himself-would then use his ruler and pencil to draw the future of bond prices based on the assumption that the historical pattern could be projected forward. Miraculously, in a bull market, the resulting forecast was usually that the market was going up.
Actually there was one good reason for using the charts: Everyone else did. If you believed that large sums of money were about to be invested on the basis of a chart, then, as dumb as it made you feel, it made sense to look at that chart; perhaps it would enable you to place your bet first and get in front of the coming wave.
Many of our French and English speculators, however, honestly believed the charts contained the secrets of the market. They are aboriginal chartists. They would have used the charts even if no one else did. They communed with their charts as if they were Ouija boards. The charts were speaking to them. Now I admit, even for a geek, it was a little embarrassing to let investors believe their white magic. But as long as the chartists placed their bets with me, my jungle guide explained, the reasoning of our customers was not for me to question. Just the opposite. Only days after landing in my new job I found myself praising such statements from investors as "I was looking at the ten-day moving average last night, and it is a perfect reverse duck tail and pheasant. Let's bet the ranch." At this juncture my role was only to shout encouragement: Yeah! Do it!"
- Michael Lewis, Liar´s Poker
En vanligt återkommande fråga inom börshandel är om teknisk analys fungerar. Svaret på frågan beror enligt min mening på vad spekulanten förväntar sig av den tekniska analysen. Om förväntningarna är att metoden ska förutse framtida händelser så anser jag inte teknisk analys fungera, men om spekulanten önskar en metod för att strukturera den till synes slumpartade prisrörelsen så är teknisk analys ett värdefullt verktyg. Genom att föra diagram erhålls en överblick över det värdepapper som handlas samt övriga spekulanters ställningstaganden.
"One thing I have noticed as I trade more is that nobody in the pit uses indicators. But most educators are trying to sell some type of an indicator, and that is just not the way professionals trade. Indicators lag. They don’t give you the signal ahead of time."
- Jack Broz, Stocks & Commodities V. 26:11
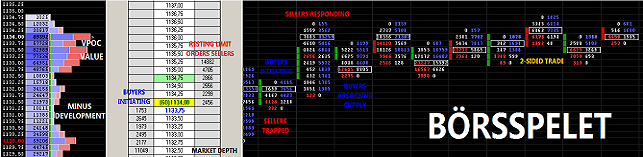
Diagram och indikatorer måste dock sättas i sitt sammanhang. De strukturerar bakgrundsinformationen men bör inte vara en självständig anledning att initiera en affär. Jag uppmärksammade tidigt att professionella handlare inte använder de metoder retail uppfostras i. Istället för att söka formationer och indikator signaler synes dessa handlare utgå från "price action" och "orderflow". Metoden, tapereading, är sparsamt beskriven i litteraturen. Richard Wyckoff förklarade anledningen härtill i boken "Studies in Tape Reading" redan 1908:
"I do not know of anyone able to read the tape with profit who is willing to become an instructor. The reason is very simple. Profits from the tape far exeed anything that might be earned by charging tuition fees to his student."
Det är min övertygelse att tapereading är kärnan i kortsiktig spekulation samt att färdigheten är läsa "price action" utan hjälp av derivata indikatorer är den edge som krävs för att lyckas inom trading.
Guesstimates on February 17, 2026
13 timmar sedan
Inga kommentarer:
Skicka en kommentar